See, for every employee, how many carried-over vacation days from the previous year are still safe, at risk, or already lost. Carried-over days must be used by 30 June; whatever is not used by then expires. This guide starts at the left menu, then walks through the year selector, filters, the summary at the top, the table, the per-employee breakdown, and Excel export. This page uses the English labels from the product.
The whole flow at a glance (loops). Each step below explains one part.
1. Open the report from the menu
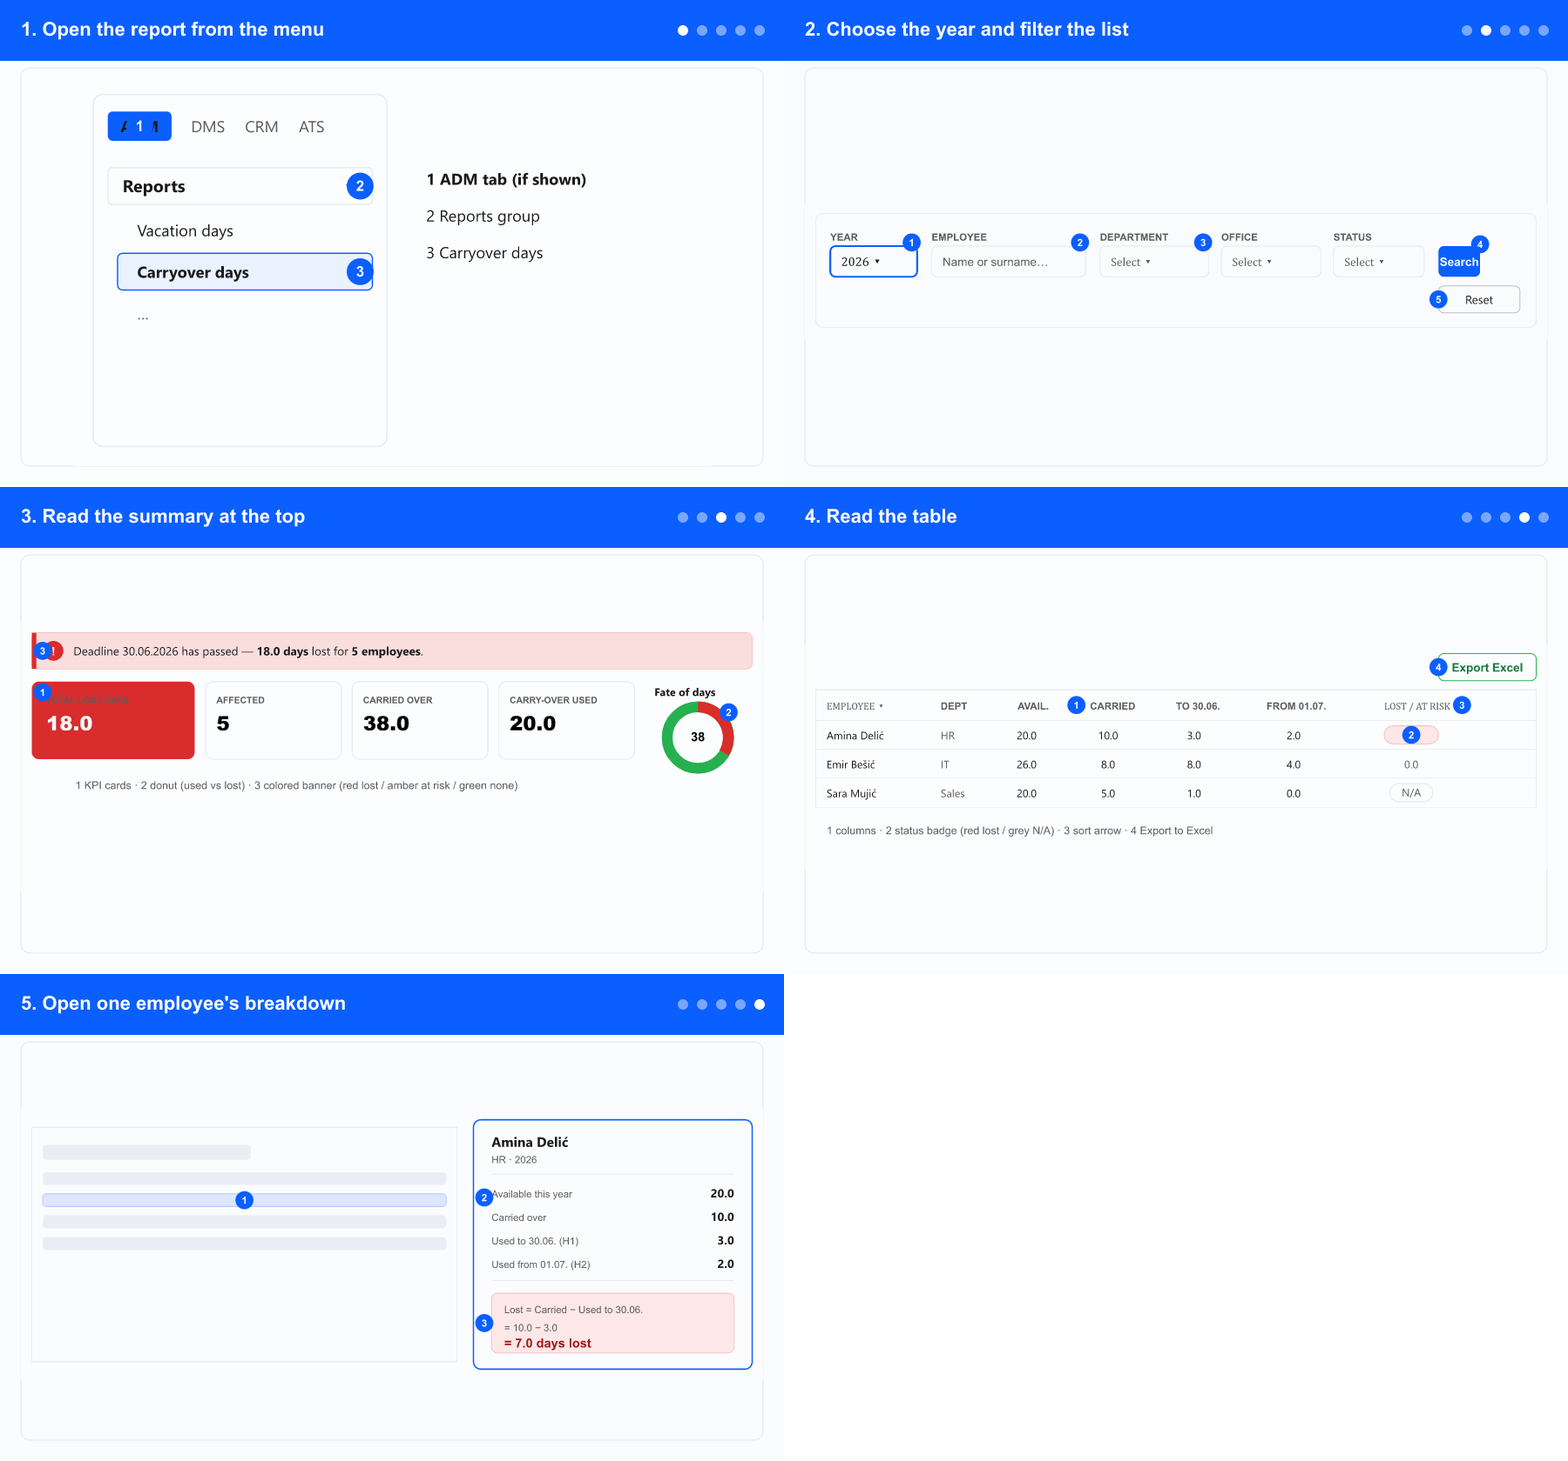
① Open the ADM tab · ② the Reports group · ③ select Carryover days — right below Vacations.
In the left menu, open the ADM tab. The tabs (ADM / DMS / CRM / ATS) only appear when your company uses more than one module — if you have a single module, the menu items are shown directly, so skip to the next step.
In the same reports group where you find Vacations, select Carryover days. Tip: you can also type Carryover days in the menu search box at the top.
Don't see Carryover days? Administrators and superadministrators see it by default; other roles need the permission — ask a company administrator.
The report opens for the current year with a loading spinner while the numbers are gathered.
2. Choose the year and filter the list
① Year (the key filter) · ② Employee search · ③ Department / Office / Status · ④ Search · ⑤ Reset.
Pick the Year — the current year or any earlier year. Changing the year reloads the report.
Type a name or surname in the Employee box to find one person quickly.
Narrow the list with Department, Office and Status — each lets you pick one or several values; leave one empty to include all.
Press Search to apply. Reset clears every filter and returns to the current year.
3. Read the summary at the top
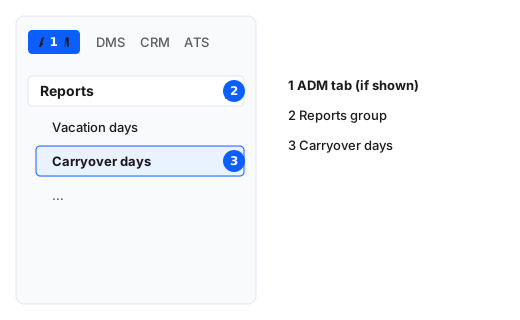
① KPI cards · ② the donut (used vs lost) · ③ the context banner — red when days are lost, amber when at risk, green when nothing is lost.
The KPI cards summarise the whole filtered list: total lost (or at-risk) days, how many employees are affected, total carried over, and how much carry-over was used.
The Fate of days donut shows the split between carry-over that was used and carry-over that was lost or is at risk.
The banner changes color and wording with the situation: red — the 30 June deadline has passed and days were lost; amber — the deadline is still ahead and days are at risk; green — nothing is lost.
4. Read the table
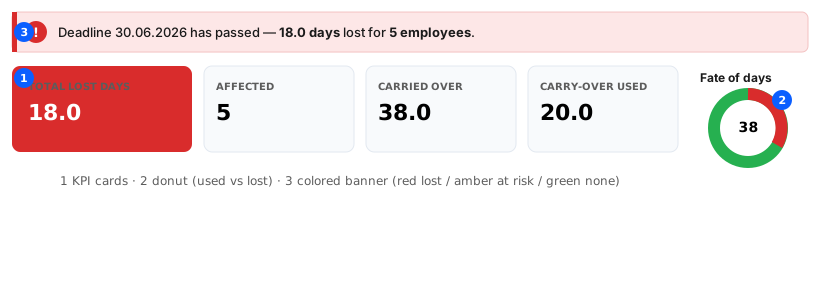
① the columns · ② the status badge in the last column (red = lost, grey = N/A) · ③ sort arrows · ④ Export Excel.
Each row is one employee, with Available (days for the selected year), Carried over (from the previous year), Used by 30.06. (first half of the year, H1), Used from 01.07. (second half, H2), and Lost / At risk.
The last column is a colored badge: red shows lost days (a past year, or the current year after 30 June), amber shows days still at risk (current year, before 30 June). Companies whose carry-over does not expire show N/A.
Only spending done by 30 June saves the carry-over. The split into by 30.06. and from 01.07. is there because it's easy to miscount which days actually counted.
Click a column header to sort; the arrow shows the direction. Click again to reverse it.
5. Open one employee's breakdown
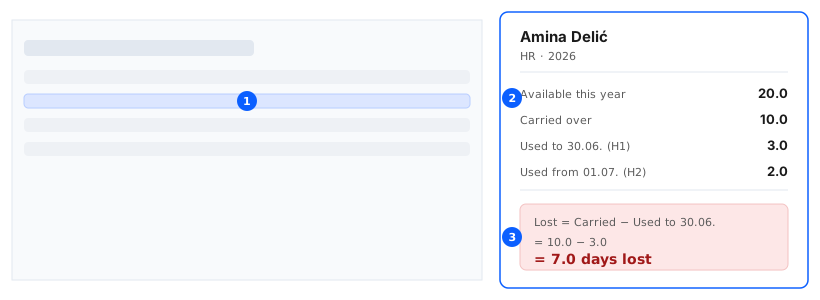
① click an employee's name · ② the breakdown of their days · ③ the formula behind the result.
Click an employee's name in the table. A panel opens on the right with that person's numbers.
The panel lists Available this year, Carried over, Used by 30.06. (H1) and Used from 01.07. (H2).
The formula shows exactly how the result was reached — for example Lost = Carried over − Used by 30.06. — so you can explain any number to the employee.
Close the panel to return to the table.
6. Export to Excel and page through the list
Use Export Excel in the report header to download the current view with the same columns you see on screen.
At the bottom of the table, use the paging controls to move between pages and to change how many rows are shown per page.
7. Tips and edge cases
A green banner and empty result are normal when nobody has lost or is at risk of losing carry-over — it is a good sign, not an error.
N/A in the last column means that company's carried-over days do not expire, so there is nothing to lose.
See a past year to review what was lost historically; the current year shows what is still at risk before 30 June.