The problem it solves
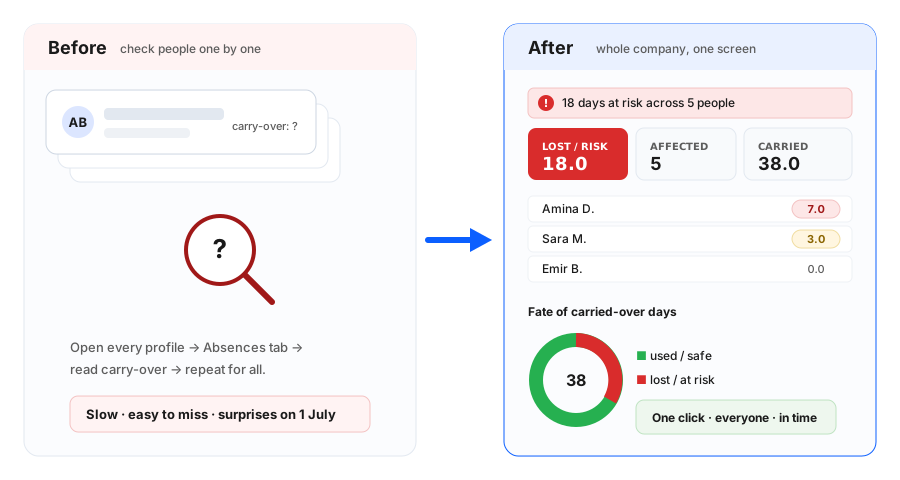
Vacation days that an employee didn’t use last year are carried over into this year—but they must be used by the 30 June deadline. After that, whatever carry-over wasn’t used simply expires. Until now there was no clear, collective picture of this: to see how much carry-over someone had left, or whether they were about to lose it, you had to open each employee’s profile and read it off, one person at a time. It was easy to lose track, and easy for employees to be caught by surprise when days quietly disappeared on 1 July.
Where you’ll see it
It’s a new report under Reports → Carryover days. Pick a year (the current one, or any past year) and the report lists every employee with the numbers that matter: days available, days carried over from last year, days used before 30 June, days used from 1 July, and—most importantly—days lost, or at risk of being lost.
What it shows you
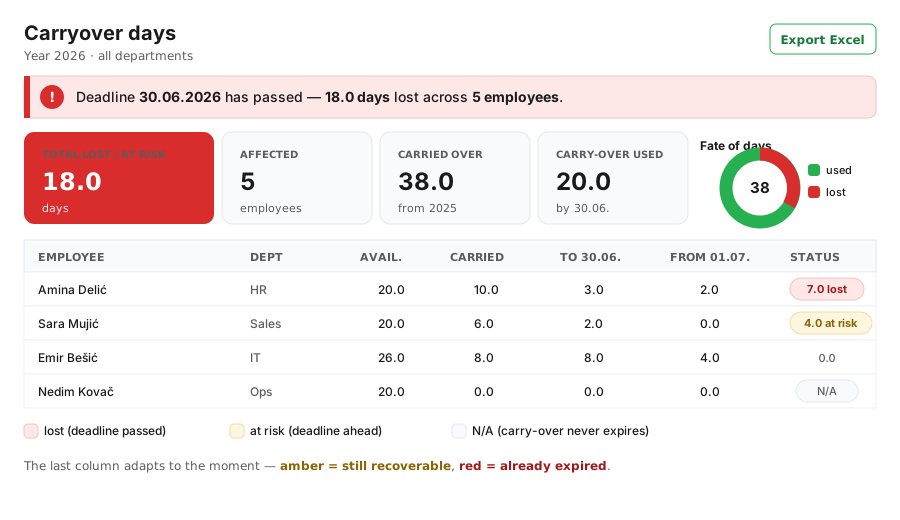
Each person’s row makes the story obvious. The final column adapts to the moment: while the deadline is still ahead it shows days at risk (still recoverable—time to act); once the deadline has passed it shows what has expired. A banner and summary cards give the headline for the whole selection—total lost or at-risk days and how many people are affected—while a small chart shows how much of the carried-over time was saved versus lost. You can filter by department, office, status, or a specific employee, sort any column, and export the whole thing to Excel.
Because the days used are split into before 30 June and from 1 July, it’s crystal clear which time off actually protected the carry-over and which didn’t—so there’s no more guessing or disputing why days were lost.
Why it helps the business
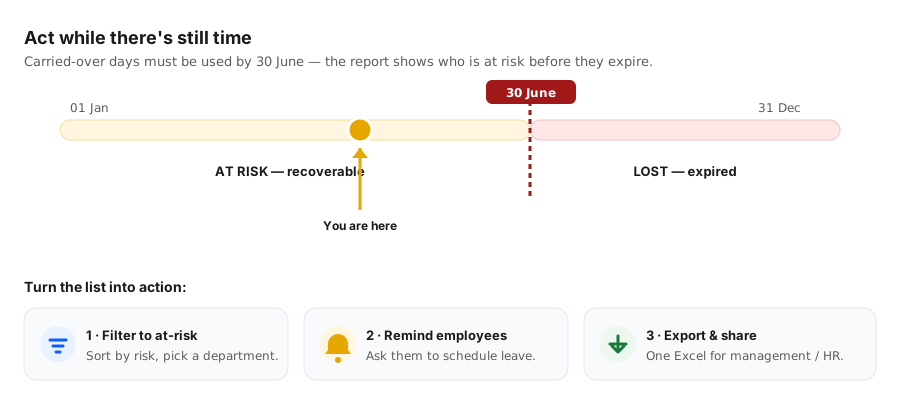
Management and HR can now be proactive instead of reactive: spot everyone at risk while there’s still time, remind them to schedule their days, and avoid the frustration of leave silently expiring. It also removes a recurring source of confusion and complaints—everyone can see the same clear numbers, for the whole company, on one screen, on a click.