Where you’ll see it

A new entry in Reporting called Absence rate by day of week. It opens its own screen with company-wide filters at the top, a row of summary cards (total absences, average rate, the day with most/fewest absences, the most common absence type), a main chart you can switch between three views, a detail table by day, and a drill-down panel that opens when you click on a day.
The report defaults to the last 12 months and to workdays only—you can change both. Filters are multi-select for absence type, office, department and position, so you can scope the analysis to the part of the organisation you care about.
What the report tells you

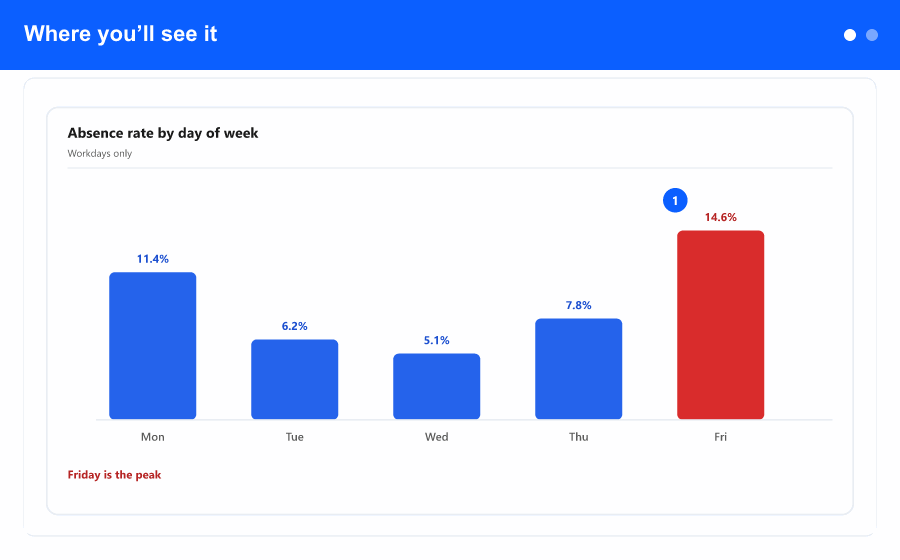
For each day of the week (Mon–Sun) the report combines two numbers HR teams ask for again and again:
- % utilisation—how often eligible employees were absent on that day (absences divided by all possible workdays for that day of week in the period).
- % distribution—how the total absences split across the week (so you can see, for example, that Mondays account for 28% of all sick days).
The main chart has three views and switches without reloading the data:
- Bars—one bar per day, easy to read at a glance.
- By type—a stacked bar per day showing the mix of absence types using their configured colours (sick leave, paid time off, training, etc.); click a type in the legend to hide or show it.
- Heatmap—weeks down the side, days across the top; deeper colour = more absences. For long periods only the last 18 weeks fit in the heatmap; the table below still covers the whole range.
The detail table repeats the per-day numbers and adds a small stripe showing the type breakdown for each day. Days that look unusually high (about 1.5× the rest) are highlighted as anomalies, so you do not have to spot them by eye.
Drill down to the actual records
Clicking any day—either a row in the table or a column in the chart—opens a side panel for that day of week with three tabs:
- List of absences—every absence record on that weekday in the selected period (employee, office, department, position, type, date; half-day records are marked, with hours when available). Search inside the list.
- Top employees—who is absent on that weekday most often.
- By type—a quick split of absence types for that weekday.
Both the report and the drill-down panel export to Excel with the same numbers shown on screen, including auto-filtering on column headers—handy when finance, payroll, or management want the data in a spreadsheet.
Why it helps the business
“Mondays and Fridays are the worst” is a feeling almost every line manager has, but until now you had to export the absence list and pivot it yourself to check it. This report turns that feeling into a number you can stand behind, by team or office, for a clearly stated period.
Concrete uses:
- Workforce planning and cover—staff the days that genuinely need more cover, not the days you assume.
- HR conversations—identify patterns (e.g. one office shows much higher Friday absence than the rest) and follow up with the right manager instead of company-wide messages.
- Policy review—test whether a recent rule change (sick-leave policy, shift pattern, hybrid days) actually moved the curve, by comparing two periods with the same filters.
- Audit / management reporting—a clean Excel with the same numbers visible on screen, no manual pivoting.