A cleaner tab, made purely for reading
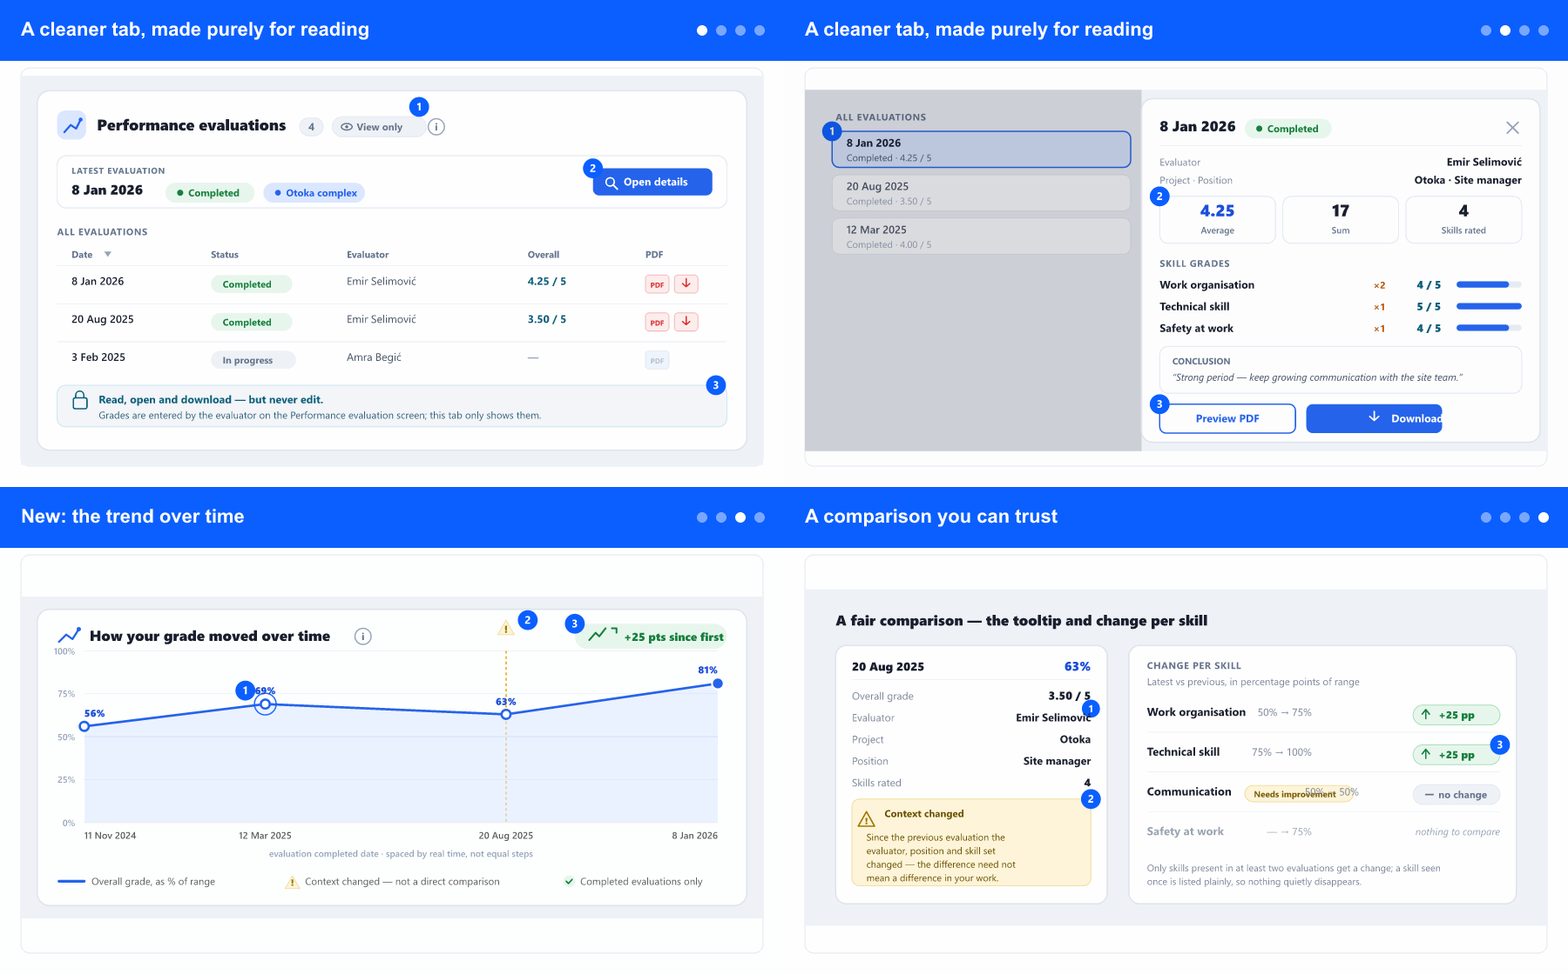
On an employee's profile, open the Performance evaluations tab. It has been rebuilt as a read-only view for the person who received the grades: there are no controls to change anything. A slim latest-evaluation strip sits at the top so the most recent result is visible immediately, and the full history of evaluations is listed below—sortable, paged, and always at hand.
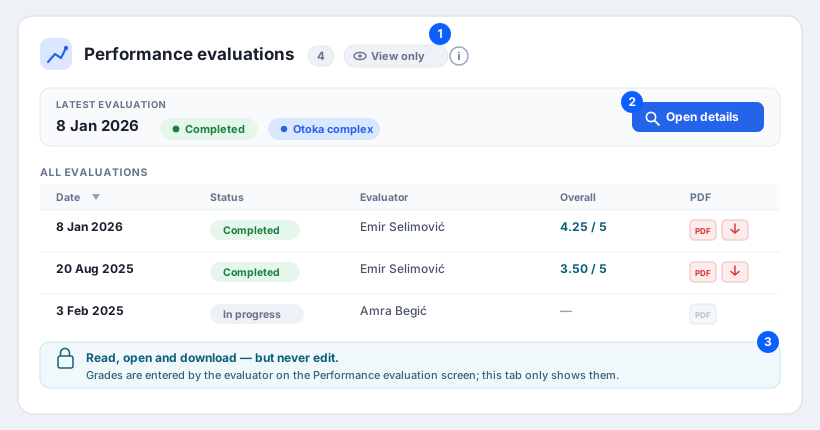
Click any row (or Open details) and a side panel slides in with the whole evaluation: the evaluator, project and position, the average, sum and number of skills rated, every skill grade with its weight and bar, and the conclusion. You can preview or download the PDF from there. Grades are still entered by the evaluator on the Performance evaluation screen—this tab only shows them.
New: the trend over time
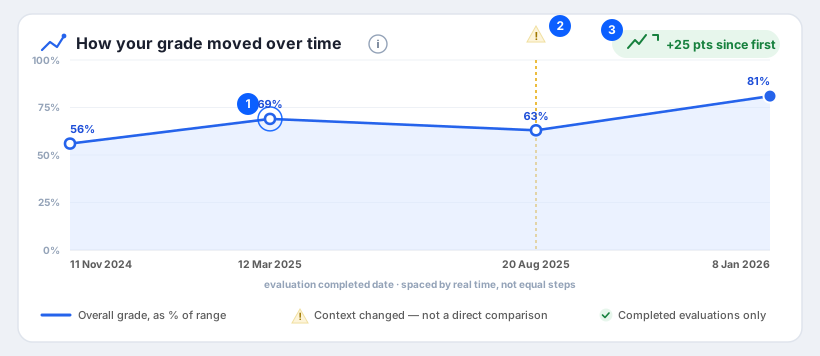
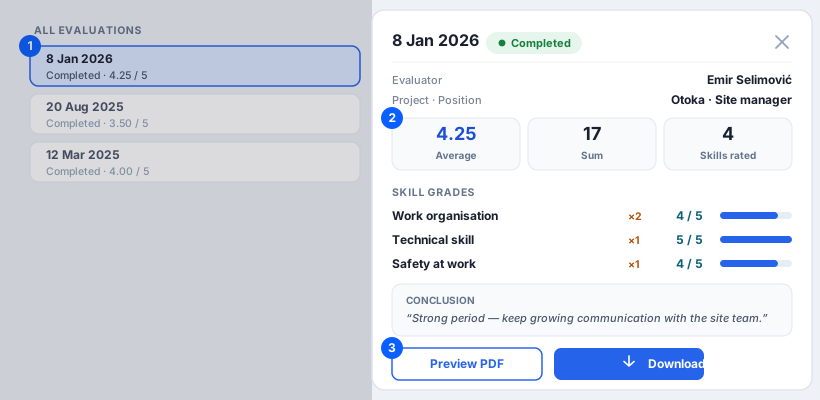
Above the latest evaluation, the tab now opens with How your grade moved over time. A single summary pill gives the headline first—for example “+25 points since the first evaluation”—then the chart plots each completed evaluation as a point. The horizontal axis is real time, so points are spaced by the actual dates between evaluations, not in equal steps.
The value on the vertical axis is the overall grade shown as a percentage of its range. Different skills use different scales and the set of skills for a position changes over the years, so a raw average is not comparable across evaluations—turning each grade into a percentage of its own range makes two evaluations comparable even when they are not made of the same parts. The raw grade is always there in the tooltip.
A comparison you can trust
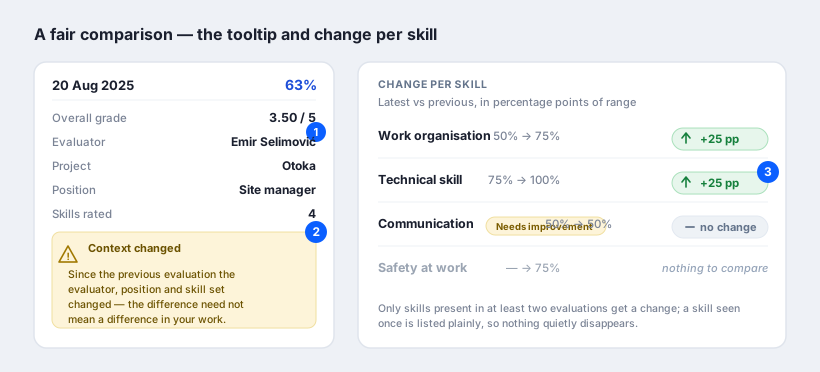
Hover a point and the tooltip shows the raw grade plus the full context: evaluator, project, position, and how many skills were rated. When any of these changed since the previous point, the chart marks it and the tooltip says so plainly—because a “drop” often means a stricter evaluator or a different position, not weaker work. Below the chart, change per skill compares the latest completed evaluation with the previous one in percentage points; a skill that appears in only one evaluation is listed with “nothing to compare” rather than quietly dropped.
Why it helps
For the person being evaluated, this turns a list of separate scores into a clear story: am I improving, where, and by how much—in language written for them, with an info popup that explains the method. For HR and managers, it is a fast, honest overview to open before a one-to-one: progress at a glance, context flags that prevent unfair conclusions, and the full evaluation and PDF one click away—all without any risk of changing the underlying grades.